
There seems to be a fair bit of talk these days about US equities potentially being in a tech-led bubble, somewhat akin to the Dotcom boom & bust of the early 2000s. This reminds me a little of this scene from the 2001 cult film “Zoolander,” where Derek Zoolander, when presented with a scale model of the “Derek Zoolander center for kids who can’t read good” exclaims: “What is this - a center for ants??” However, in the present context, I would change the wording to “what is this – a bubble for ants?”

Yes, Nvidia has led US markets higher this year – but this has hardly been a “tech party” akin to the Dotcom bubble
It’s true – Nvidia (which reports results tomorrow after the US close) has contributed a disproportionate share of US market returns this year: of the ~25% YTD gain for the S&P500 (through 18 November), Nvidia has contributed almost 1/4, or 5.8 percentage points.
However, this doesn’t mean that we’ve really had a “tech-led” market this year, and certainly when one zooms right out, this market has a very different look to the Dotcom period of the early 2000s.
A few factual anecdotes to provide context:
1. The median stock return on the S&P500 this year has been 17% so far. If we exclude Nvidia’s outsized single-stock contribution to index returns, this is not that far off the 19.6% aggregate return of the remaining 499 constituents. Participation is broader than is suggested by widely held perceptions that “it’s all been about the Magnificent Seven this year.” Even outside the biggest 10 contributors to index returns this year (of which a bank - horror of horrors! - is one), the median gain of the remaining holdings has been a very solid 16%:
Figure 1: Return attribution of S&P500 year to date
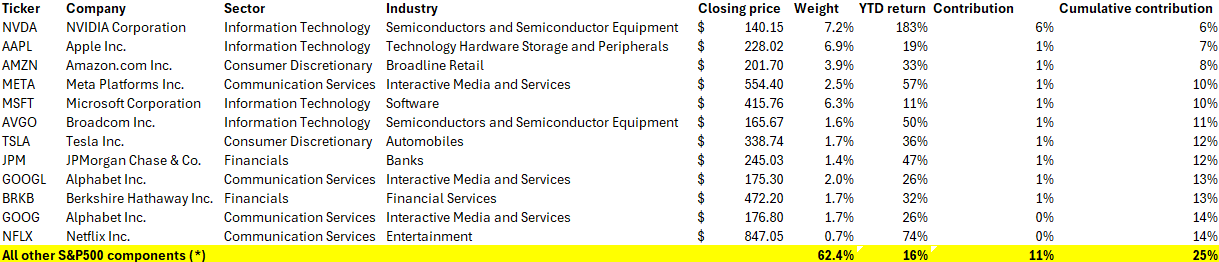
Source: Koyfin data
2. At a sector level, Information Technology – the very sector in which Nvidia resides – has not been a stand-out performer this year for the average stock, suggesting Nvidia has very much been a phenomenon by itself. The best performing sectors? Financials and Utilities (admittedly, the latter contains some second-order AI-plays, such as nuclear power providers (eg Constellation Energy +98% YTD) needed to keep up with the rising electricity demands of AI datacenters).
Figure 2: Median stock returns by sector - S&P500 YTD
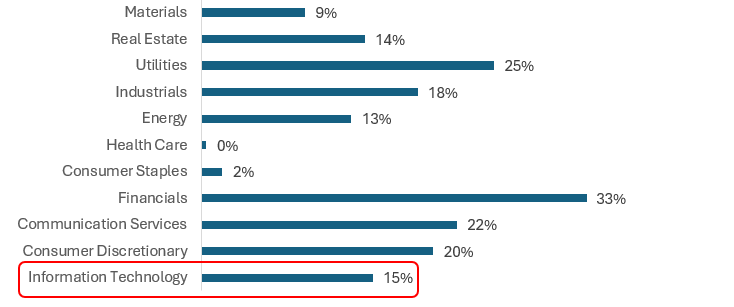
Source: Koyfin; data to 18 November 2024
Another way of looking at this is to assess the relative performance of the tech-heavy Nasdaq 100 index against that of the S&P500 (which obviously has a large tech component to it, but it more broadly diversified across stocks and sectors). Year to date, the Nasdaq 100 index has underperformed the S&P500 by 1.8%, while on a rolling 12-month basis it is 1% behind its larger peer:
Figure 3: Nasdaq 100 relative to S&P500: 12-month rolling return differential
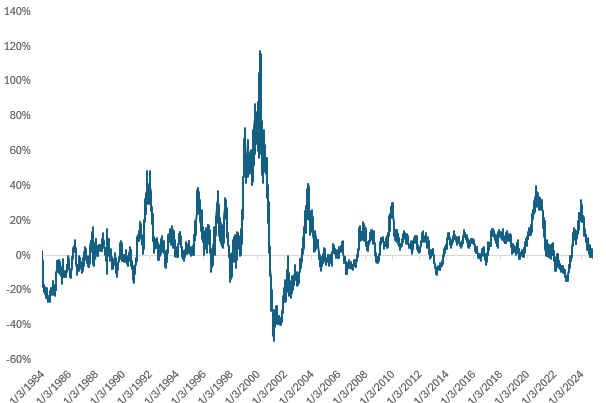
Source: Refinitiv data; author calculations (capital returns only)
Note from the above chart the dramatic extent of outperformance (and subsequent underperformance) of the Nasdaq over the S&P500 during the Dotcom bubble – by comparison, the last 12 months looks quite unremarkable as far as relative returns are concerned. In a tech-driven bubble, we should expect to see dramatic outperformance of the Nasdaq 100 versus the S&P500. This is simply not the case today.
Similarly, when extending the above analysis out to 3-year annualized returns, it is notable just how long the Nasdaq has not outperformed the S&P500 – quite unusual, by historical precedent. In fact, the Nasdaq’s current 3 year annualized relative return vs S&P500 falls into the 20th percentile of historical observations going back to 1986. Over this time frame, the Nasdaq 100 has outperformed the S&P500 by close to 4% per annum, on average.
Figure 4: Nasdaq 100 relative to S&P500 - 3 year rolling return differential, annualized
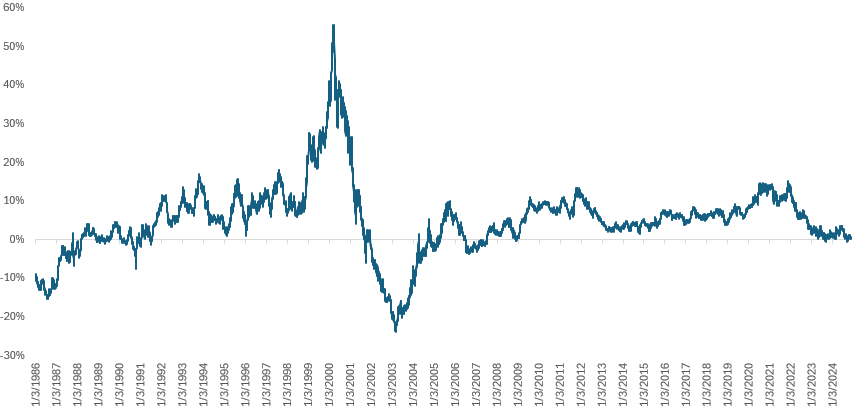
Source: Refinitiv; author calculations
Finally, while it is certainly true that the rating of US equities, as measured by the forward P/E of the S&P500 index (~23x today), are elevated relative to historical averages, on a relative basis the Nasdaq, at a 20% forward P/E multiple premium, is now as cheap as it was versus the S&P500 as it was at the Covid lows, and very much consistent with historical relative ratings.
Figure 5: Nasdaq 100 forward P/E relative to S&P500 (QQQ / SPY ETF ratings)
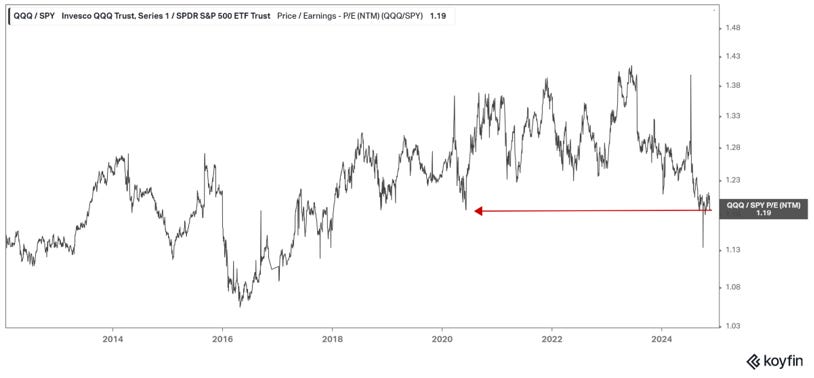
Source: Koyfin
For an even longer history, I’ve compared the trailing P/E relative for the Nasdaq vs S&P500 going back to the early 80s; the current relative rating falls into the 33rd percentile of observations over this time frame:
Figure 6: Trailing P/E relative: Nasdaq 100 relative to S&P500
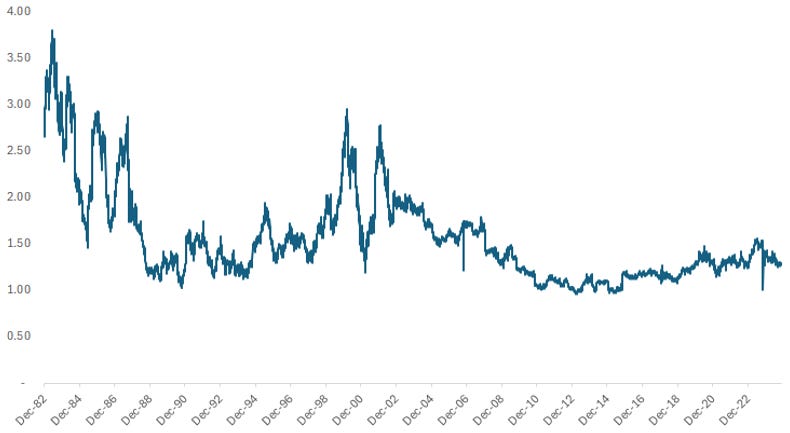
Source: Refinitiv data; author calculations
If we are to conclude that US equities are in a bubble, it would certainly not yet be a tech-led bubble - and with aggregate valuations nowhere near as egregious as they were in 2000/01.
A “bubble for ants”, then?
The above article is the authors personal opinion and views and should not be construed as advice, nor relied upon for investment decision making purposes.
Clown🤡